When designing a Safety Instrumented Function (SIF), practitioners often encounter a complex scenario: multiple initiating events (independent causes) leading to the same hazardous consequence. While common industry practice is to design for the "worst-case" scenario in isolation, this approach contains a hidden danger. A groundbreaking whitepaper from exida reveals why it is critical that the cumulative effects of multiple initiating events be considered together during LOPA. Failure to do so can compromise your entire risk reduction strategy.
What is LOPA
In process safety, Layer of Protection Analysis (LOPA) is the bridge between qualitative hazard analysis and rigorous engineering. It identifies which safeguards qualify as Independent Protection Layers (IPLs). When a SIF is involved, the LOPA determines its required Safety Integrity Level (SIL) and expected demand frequency. If the “worst-case” analysis under-represents actual risk, the safety instrumented system (SIS) design will too.
The Trap of the "Worst-Case" Scenario (Single Cause)
Because standard industry resources, such as the CCPS Layer of Protection Analysis book, offer limited guidance on multi-initiating event scenarios, many engineers default to the "Worst-Case" event as their sole design basis. While this seems conservative, it ignores the cumulative impact (residual risk) of multiple initiating events that can all lead to the same hazardous consequence.
Failure to consider the cumulative effects of initiating events together often results in:
- Inadequate SIL Targets: You might specify a SIL 1 SIF when the combined risk actually demands a SIL 2 function to meet your risk reduction target.
- Underestimated Demand Frequency: The SIF may be called upon much more often than your design assumes, leading to unexpected shutdowns.
- Misjudged Demand Mode: A SIF believed to be "Low Demand" might actually be operating in "High Demand" mode. This is a dangerous distinction, as High Demand functions require entirely different testing intervals, advanced diagnostics, and in some cases, additional channels (redundancy), to remain effective.
- Inadequate Proof Test Intervals: You could be testing the SIF with higher than required intervals.
Case Study
The whitepaper uses a case study involving a fired heater—specifically the "loss of pilots" with a potential for fire/explosion—to demonstrate the differences between analyzing risk in isolation (single worst-case scenario) versus using a combined approach (multiple initiating events).
1. LOPA Evaluation as Individual Records (Worst Case Scenario)
In this traditional method, each "cause/consequence" pair from a HAZOP is evaluated as a standalone record. For the fired heater example, the analysis of three separate causes yielded the following results:
- Cause 1 (Human Error): A battery limit natural gas ball valve (remotely actuated valve) is inadvertently closed. With an enabling condition (personnel presence) and an operator alarm as an IPL, the SIF demand frequency was calculated at 0.01/year, requiring a SIL 1 target (RRF of 10)
- Cause 2 (Control Failure): The natural gas control valve to the pilots fails. This scenario resulted in a SIF demand frequency of 0.1/year, requiring a SIL 2 target (RRF of 100). [See Figure Below]
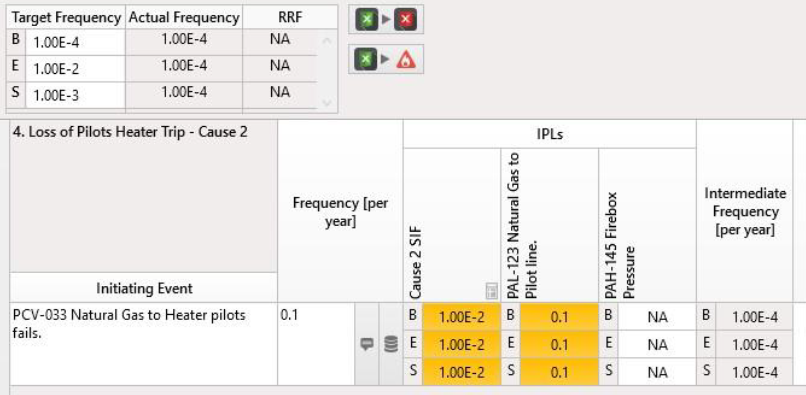
Figure 1. LOPA Analysis for “Worst-Case” Scenario
- Cause 3 (Human Error): The combustion chamber steam is inadvertently opened (remotely actuated valve). Similar to Cause 1, this resulted in a demand frequency of 0.01/year and a SIL 1 target (RRF of 10).
|
|
SIL Target |
SIF RRF target |
Demand Frequency / year |
|
Cause 1 |
1 |
10 |
0.01 |
|
Cause 2 |
2 |
100 |
0.1 |
|
Cause 3 |
1 |
10 |
0.01 |
Table 1. Cause/Consequence Pair Analysis Summary
The Pitfall: In many cases, designers would simply select the "worst-case" scenario (Cause 2) as the design basis for the SIF. This ignores the cumulative risk of all three causes occurring.
2. A More Accurate Approach: Combined LOPA Evaluation (Multiple Initiating Events)
The paper introduces a framework using tools like exSILentia® to view multiple initiators in a single, comprehensive view. This method allows for a more rigorous analysis of how Independent Protection Layers (IPLs) perform against the total risk landscape, including each risk receptor.
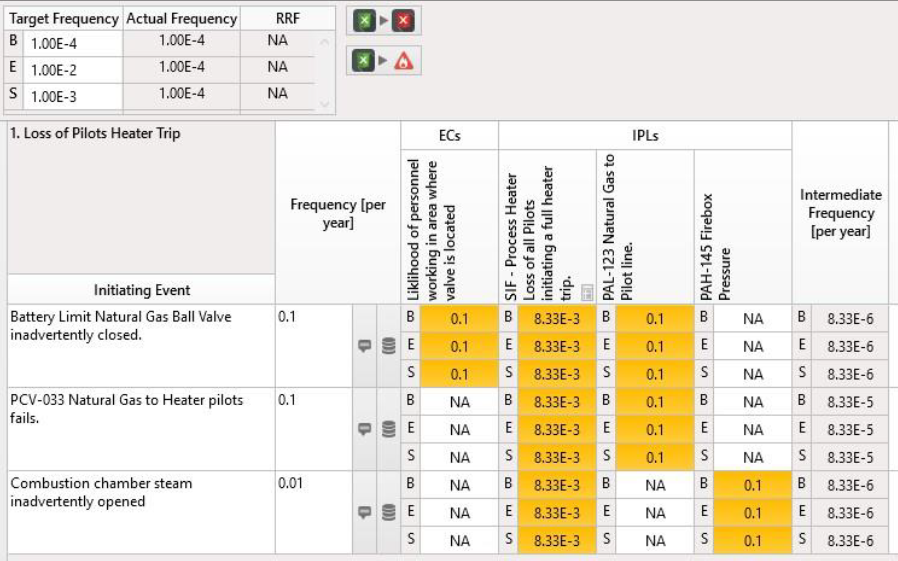
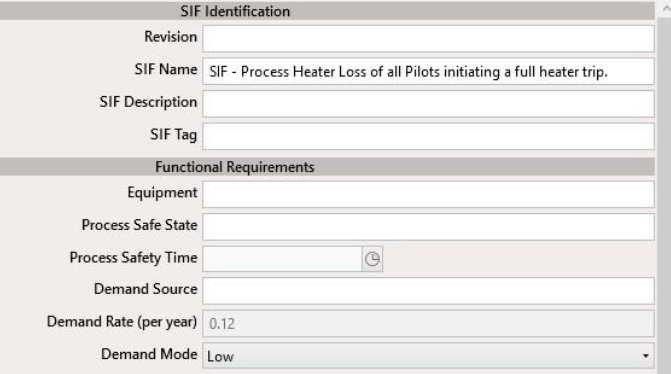
Figure 2. exSILentia Analysis Showing Results of all Three Initiating Events in a Single View
By evaluating all initiating events simultaneously, you gain a true picture of the cumulative impact on your Safety Instrumented Function (SIF):
- Cumulative Demand Frequency: In the fired heater example, looking only at the "worst case" yields a demand of 0.1/year. However, the software sums the actual frequencies (0.01 + 0.1 + 0.01) to reveal a total demand of 0.12/year.
- Adjusted SIL Targets: While the example remained a SIL 2, the required Risk Reduction Factor (RRF) jumped from 100 to 120. In many real-world scenarios, this cumulative math is the difference between a SIL 1 (high RRF limit) and a SIL 2 requirement.
- Demand Mode Confirmation: This is the most critical catch. If cumulative effects are missed, a SIF might be incorrectly categorized as "Low Demand." If it is actually operating in High Demand, your current testing intervals may be insufficient, leaving the system vulnerable to undetected failures. For a SIF to be considered to operate in Low Demand, the Proof Test Interval must be a least twice the expected demand frequency.
Comparing Worst Case to Combined Analysis
The data in Table 2 highlights a dangerous gap. While the individual "worst-case" analysis seems sufficient, it ignores nearly 20% of the actual risk in this scenario.
|
Metric |
Cause 2 (Individual “Worst Case”) |
Combined Analysis |
|
Demand Frequency / year |
0.1 |
0.12 |
|
SIL Target |
SIL 2 |
SIL 2 |
|
Minimum RRF Target |
100 |
120 |
Table 2. Comparing Worst Case Results to Combined Analysis
Separating cause/consequence scenarios results in a consistent underestimation of both demand and the required RRF. The composite LOPA is effective in analyzing multiple initiating events because it takes into account the residual risk for each scenario. While mathematically you could sum individual records manually, this step is frequently overlooked in high-pressure engineering environments. The more initiating events exist, the higher the difference between the results for the two approaches will be.
Conclusion: Don't Leave Safety to Chance
LOPA is an invaluable tool for risk management, but its effectiveness is limited by its scope. By moving beyond single-cause analysis and embracing a combined view of initiating events, safety professionals ensure their SIFs deliver the risk reduction they were actually built for.
The bottom line: In process safety, the "worst-case" isn't the whole story. Don't let an overlooked summation lead to an under-designed safety system. Use a combined LOPA evaluation to capture the full picture and ensure your facility is truly protected against real-world demands.
For more detailed insights on SIF demand mode and proof test intervals, you can read the full white paper: "Considering Multiple Initiating Events in a LOPA" by Denise Chastain-Knight and Loren Stewart. This paper was presented at the Mary Kay O’Connro Process Safety International Symposium in October 2018.
Tagged as: SIL Target Selection SIL LOPA